
LandlordMax Sales Mapped in the US
Last week in a discussion with LandlordMax‘s publicist Randy Ray over email, he asked me in which cities we had sales. That quickly reminded me of Ian Landsman’s post on his blog about his company’s customer map (HelpSpot). So I thought why not make a similar one for LandlordMax, a LandlordMax Customer Map if you will.
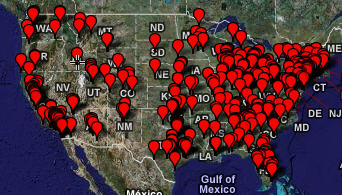
The map above consists of all the sales we’ve had in the US over the last year and a bit (excluding Alaska and Hawaii as well as Canada and any international sales). I originally had all sales but it was impossible to get any value from it. As well please note that each city is included only once, so if we have one or one billion sales of LandlordMax in New York city, it’s only considered as one dot here. I didn’t know how to scale up the map points, so if anyone knows how I’d be appreciative if you could share.
As well I’d like to give a quick thanks to GPSVisualizer.com for their free service. I took the easy way and had their site generate this map. It’s a great tool! Otherwise I would have used the following PHP code by Monte Ohrt as recommended by Ian.


· February 25th, 2008 · 2:11 pm · Permalink
I’m not sure if I know exactly what you mean by “scale up points,” but using GPS Visualizer’s “data” form — https://www.gpsvisualizer.com/map?form=data — you can resize (and/or colorize) points according to the parameter of your choice.
· February 25th, 2008 · 2:39 pm · Permalink
Hi Adam,
I did see that option, which btw is great!
By scaling up, I mean if you have for example 2, 10, 100, 1000, 1 million, etc. points for a particular city (location), it would be great if that point could be larger (in proportion) to the others. So for example if the data included 1 million points to NYC, it would be great to see the NYC point larger than the others, preferably in proportion.
Does that make more sense?
And again, let me just re-iterate, for those of you who haven’t checked out GPSVisualizer.com yet, you probably want to, it’s got some great tools as you can see from the map I generated!
· February 25th, 2008 · 3:29 pm · Permalink
That’s exactly what the data form can do, if you set it to “calculate frequency.” For instance, if you enable resizing by “n” and automatic frequency calculation, and your data looks like this:
city,state
New York,NY
New York,NY
Buffalo,NY
…it will draw the New York marker larger than the Buffalo one.
However, if you really do have 1 million points in a particular location, and only a handful for others, it wouldn’t be very useful, as the million-instance marker would swamp all of the others. It’d be better in that case to compile an Excel sheet (a pivot table, maybe?) that assigned a smaller range, say 1 through 5, to various exponential frequency “bins.” For example, n=1 would represent 1-10, n=2 would be 11-100, n=3 would be 101-1000, etc. Then the map would be easier to read.
· February 25th, 2008 · 3:41 pm · Permalink
Looks like I completely missed that option! I’ll take a look as soon as I have a minute. Thank you very much for letting me know.
· February 25th, 2008 · 3:49 pm · Permalink
Just note that the automatic frequency calculation will use whatever fields it can find that might mark a location, so you’d have to upload ONLY cities and states. Or only states. Or only ZIP codes. If you include names or addresses, it won’t work, as each point would be tallied up individually.
Eventually, by the way, I’m going to include support for 3-digit ZIP codes, which may be helpful for applications like this.