LandlordMax Property Management Software Status Update
There’s good news and some not so good news regarding the next major release. First some of the good news. We’re almost done with major architectural changes which include a complete change of the database engine. It also included a major change in the way every table is displayed so that they can be sorted by any column, etc. These changes have been substantial structurally speaking, it’s as though we changed the engine and some of the internals in a car. The not so good news is that these changes have been harder than we expected, and therefore are taking longer to complete.
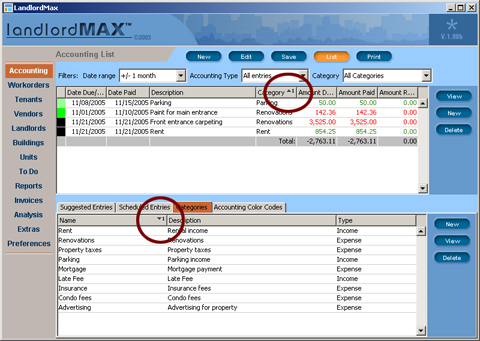
Sorted Table Columns
What does this mean for you? It means that the latest major release of LandlordMax Property Management Software (version 2.12) will be postponed until February of 2006. In my personal opinion and experience, it’s unwise to force a premature release with major changes this complex out before it has been completely tested, especially considering that next month is X-mas when most people go on holidays (not to mention the X-mas plans of our beta test members). What we’ll do instead is release it in February of 2006, but the good news is that we’ll mark the version as though it was released in December of 2005, giving you all an extra 2 months of free upgrades! I would rather absorb this cost than release a sub-standard version of LandlordMax.
If you’re interested in finding out more details about this release, please read on here…
Before I get into details, let me just say that this has been our most extensive release by far to date. There will be many new features in LandlordMax Property Management Software, not to mention reports, however the biggest changes and costs have been structurally.
Indeed, our biggest cost was changing database engines. Although it might appear simple, where we can just swap database engines as the theory suggests, reality does not work this way. Our prior database engine (hsqldb) had some shortcomings that we worked around that no longer apply to the new database engine (derby). On top of this, we could do some things with the old database engine that are no longer possible with the new one. If you want to read about why exactly we changed database engines, you can find my prior article here.
The hardest task for us in changing database engines wasn’t just the hook ups, it was to make the process of upgrading from one database engine to another seamless, that is to make it happen without the user being aware of it. I know that if I personally bought a product defined as the easiest in its category, I wouldn’t want to know the details of how it worked internally. As an analogy, if I swapped a car’s engine, I would want it to start by turning the key just like it before, I don’t want to manually change the engine myself, or have a bunch of new toggles to manipulate. I just want to turn the key, that’s all. And as you all know, changing a car engine is not a simple task!
The next biggest cost for us was re-structuring each table to give it the ability to sort by any column. I won’t go into the details, but suffice it to say, I wrote a whole article here a while ago about the complexities of it, so if you’re interested please read it. I didn’t realize until after writing about how much effort we had put into it. In any case, after having gone through the process, we decided that to release this version in a timely manner, we would forgo the concept of hierarchical tables (tables that can be collapsed and expanded), which would be nice for reports such as “All accounting entries grouped by categories”. Therefore this has been postponed to a future release.
Another major feature that we’ve added is the ability to store pictures in tabbed panels for the building, unit, and tenant workareas. The pictures will be listed in a thumbnail view and can be clicked on to be displayed in a larger popup window. This is a feature that was greatly requested and we’ve been doing our best to implement it. We’re currently in the final stages of developing this new feature.
Although we anticipated having graphs in our reports, due to time it took us to sort the tables (reports), we have come to the conclusion that this feature will have to be postponed to a future release. Graphs would be a great feature, however due to the sheer number of reports, it will take a considerable amount of time to fully implement. It has therefore been postponed also.
The reports section is still anticipated to have several new reports. We’ve already added several and we expect to have a few more before we release it. I won’t go into the details of listing the reports, but suffice it to say that we’ve added many of the reports that have been suggested to us (also every report that is not grouped by something can now be sorted by any column, as well as printed in that sorted order).
There are several other significant changes that I won’t go into details here, but they include the ability to add your logo to the printed reports, auto-update reminder when new releases become available, new fields, etc.
As I mentioned before, I would prefer to take an additional two months to properly prepare the software for release rather than going live with an incompletely tested version next month. Because of this delay, we will honor the release as if it was in December of this year (I doubt many other software companies would do that), and we will do our best to get it out to you as soon as possible. I will keep you updated of our progress because I’m sure that you appreciate it as I would.
Permalink to this article Discussions (0)
Asset Risk Management
Today’s article has been inspired from a book I’m currently reading entitled Fortune’s Formula. Although the book is fairly verbose, it’s worth the read because it does have some very interesting insights and ideas. The main focus of the book is how to manage risk of your assets, regardless of what the asset is. For example, it compares the Kelly System (original paper in pdf format), the Markowitz system, etc. The basic idea is how can you increase your wealth the fastest while minimizing your risk.
Although I’m not yet finished reading it, one chapter really caught my attention. entitled “Shannon’s Demon”. In there the author (William Poundstone) talks about a system devised by Claude Shannon where it appears theoretically possible, and I’ll explain why I say theoretically in a bit, to make profit from the fluctuations of an asset (both when it goes down and up).
The system is very simple and elegant. You start with a certain amount of cash, let’s say $200. You divide this sum equally into cash ($100) and the asset ($100). Then each round (time unit which can be minute, hour, day, month, year, whatever) the asset either doubles or halves. Yes, it can halve and you can still make money! Now at the end of each round you rebalance your portfolio to split the cash and assets 50/50. So for example, if the asset doubles to $200, then you rebalance your wealth ($300 = $200 asset and $100 cash) so that you have $150 in cash and $150 in asset. If it halves, you rebalance it ($150 = $50 asset and $100 cash) so you have $75 in each. You repeat this for as many time steps as you want and you will find that the result is a geometric (i.e. exponential).
In the previous paragraph I allude to the idea that it was theoretically possible. Why did I say this? Because reality doesn’t quite allow for this system to be possible. Firstly, if you were to wait until real estate or stocks doubled and halved it might take a very long time. Therefore this would only be possible with games of change with an even odd of winning and losing. The other aspect is that if you actually went ahead and did this with either real estate or stocks, you’d have to take into consideration fees of buying and selling the assets, not to mention tax considerations. However, ignoring these aspects, it’s a very interesting and thought provoking idea because it really helps to appreciate that it is possible to make money on volatile assets that move up and down.
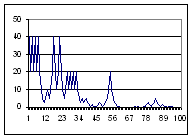
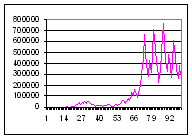
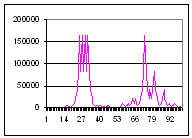
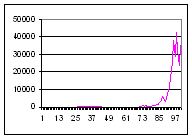
I took a few minutes tonight to write a simple Java program to test this concept. For you technical people, you can find the source code here and the class file here. The program will output to the screen tab delimited lines which you can use in MS Excel to generate the graphs. In any case, I ran it a number of times with runs of 100 time units with equal probabilities of the asset going up and down. What was very interesting is that no matter what, assuming the asset didn’t go bankrupt, you made exponential revenue. If the asset did go bankrupt, you still made a nice profit up to that point (assuming it didn’t go bankrupt right away and lasted for at least a few up movements). You’ll find 5 of these sample runs below with the wealth graph on the left and the respective asset price graph on the right (the asset always started with a $20 value and the wealth with $100 cash and $100 in assets).
Scenario 1 (Data File)
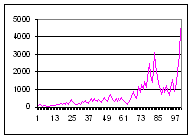
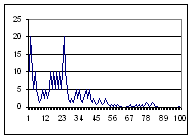
Scenario 2 (Data File)
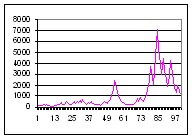
Scenario 3 (Data File)
Scenario 4 (Data File)
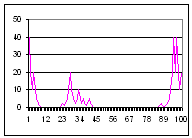
Scenario 5 (Data File)
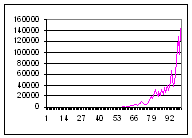
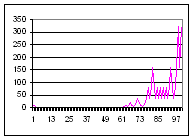
As you can see from every single graph above, no matter how low or high the asset price went, it still seemed to generate a handsome profit. Although I didn’t post any of the graphs where the asset loses all of its value, you can see from some of the examples that even when the asset price is almost completely wiped out the wealth graph is still much higher than the original $200 in wealth. It’s also much higher than if you had just stayed and rode the stock all along!
Of course please don’t think that I’m proposing that getting in and out of the assets is necessarily a good thing, because like I mentionned before, once you start to take into account the transaction costs and capital tax costs, not to mention the amount of time it takes for a normal asset to double and halve, it pretty much makes this model impossible. I still strongly believe in the buy and hold model and therefore this article is more to bring forth some new ideas and ways of thinking about assets and risk management.
Permalink to this article Discussions (3)
Location, Location, Location
Everyone has heard the cliche that the three most important factors in buying a property are “location, location, and location“. Just how important is location in determining the price of property? It’s very important. I came accross a study this week done by Coldwell Banker which compared the prices of properties. The study surveyed prices of similar homes in 324 real-estate markets for a similar 2,200 square foot, four-bedroom, two-and-a-half bath, two-car garage house. The difference between the most expensive and the cheapest was very large! The biggest gap was between La Jolla, California, and Killeen, Texas. You could either own 1 of these properties in La Jolla, California, or 14 identical ones in Killeen, Texas! And with even with the 14 properties in Killeen, Texas, you’d still have $36k left over!
Why such a big difference? Because of the desirability of the locations. La Jolla is a beautiful city California perched on the Pacific Ocean with lots of coastal properties, it has year round beautiful weather, lots of amenities, and so on. In contrast, Killeen is a city built around an army base in the middle of the prairies with much harsher weather. Should the discrepency be so large? That’s a debatle subject, however the reality is that it is.
| Most Expensive Markets | ||||||||||||||||||||||
|---|---|---|---|---|---|---|---|---|---|---|---|---|---|---|---|---|---|---|---|---|---|---|
|
| Least Expensive Markets | ||||||||||||||||||||||
|---|---|---|---|---|---|---|---|---|---|---|---|---|---|---|---|---|---|---|---|---|---|---|
|
Permalink to this article Discussions (0)
Some Markets Are Already Starting to Fall. Good Times Ahead for Real Estate Investors
Today I came across an article online from the Boston.com entitled “Suddenly, area’s housing market favors the buyers“. This article was very interesting for several reasons. Firstly it seems to indicate that several real estate markets are starting to collapse, as I’ve been predicting for a while now. Also, although the article states many reasons for the decline in real estate property prices, I personally believe that the main contributor is the increase in interest rates. This is good because it makes it much easier to calculate approximately how much the real estate market should fall.
In any case, the good news for real estate investors is that there will be profitable cash flow rental properties available in the market once again. So start preparing your finances to be able to capitalize on it.
Some interests highlights and exerts from the article:
- In Jamaica Plain, a $70,000 price cut (15% of the total purchase price) for a house on the market for about a month generated only four people for an open house (two of which were the neighbors).
- “‘My seller is willing to consider a lower price’, said the broker, Anne Connolly, ‘but there’s no buyers to deal with.'”
- One Remax broker said that she is still selling houses, but at prices 5-to-10 percent lower than what comparable homes sold for in spring.
- “the number of condominiums listed for sale is up 50 percent from a year ago, while the number of price cuts has more than doubled“
- “Recently, after viewing a home in Norwell, listed at $645,000, Brown was told as he walked out, ‘We’ll take $535,000.’“
These are all very telling snippets of information from this article! All six reveal just how the market is truly doing. Again, as I mentioned before, this should be great news for real estate investors. Money is made in low markets, not high markets, so prepare yourself because the market is about to get very interesting in the near future!
Permalink to this article Discussions (0)


