
Why a Balanced Portfolio Can Be Bad For You
I strongly believe a balanced portfolio, and especially the act of continually re-balancing it, is bad for you! Why? For three main reasons:
1. You shouldn’t have to force yourself to invest an exact percentage of your net worth in specific investment assets just to match your asset allocation percentages (for example you shouldn’t have to invest 50% of your money in stocks just because that’s what you allocated to it, there might not be that many deals out there worth it).
2. Each time you re-allocate you’re penalized with broker commissions and capital appreciation taxes
3. The most important point, each time you re-balance your portfolio, you’re losing money by moving money from your best performing assets to your worst performing assets. I’ve never ever seen this as a good way of making money!
Before I explain these three points in detail, let’s first look at why the modern balanced portfolio was created. Balanced portfolios were built with the intention of reducing market volatility. To quote, “The underlying logic behind the hybrids is simple: when stocks are hot, the funds will be able to tap the trend. When stocks are shaky, investors will probably seek shelter in bonds. That’s when the bond portfolio of a balanced or asset allocation fund will steady things.”
I don’t deny this one bit, a balanced portfolio will generate a much smoother growth curve for you with reduced volatility, there’s no doubt about. You’ll see this in the examples I use to illustrate my point below. You could even create a real concrete sample with the exact values of the last 20 years and show very similar numbers. I would have done this except that I didn’t have the real numbers handy when I created these charts. If you have them, please feel free to post a link in the comments below and I’ll add a further example as time permits. In any case, the reality is that yes, it will reduce your market volatility. However, the longer you stay in the market and the more astute an investor you are, the less this is an issue.
Ok, we talked about reducing market volatility, but what about getting the best return? The balanced portfolio was not created to get the best return, it was created simply to reduce the volatility. It does this at the expense of a better return! I’m not willing to trade this, especially not after working the numbers. The difference is just not worth it…
Alright, now that we understand why this investment style was created, let’s look at why it’s not good. Let’s start with the easiest and simplest reason why not. How do you know what a correct balanced portfolio of your assets is? Is 50% in stock and 50% in bonds a good asset allocation? What about 25/75, 75/25, 10/90? What about a portion in options, commodities, etc. How do you really know what a good allocation is? What’s actually interesting is that depending on how you do this allocation, it will greatly affect how much return your going to receive versus how much volatility you’ll also receive. The more conversative the lower the return and volatility.
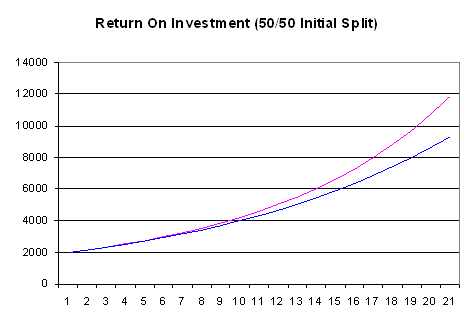
| Year | Bond | Stocks | Total | Return | Rebalance Bond | Rebalance Stock | New Total | Total Return |
|---|---|---|---|---|---|---|---|---|
| Start | 1,000.00 | 1,000.00 | 2,000.00 | 1,000.00 | 1,000.00 | 2,000.00 | ||
| 1 | 1,040.00 | 1,120.00 | 2,160.00 | 8.00% | 1,080.00 | 1,080.00 | 2,160.00 | 8.00% |
| 2 | 1,081.60 | 1,254.40 | 2,336.00 | 8.15% | 1,166.40 | 1,166.40 | 2,332.80 | 8.00% |
| 3 | 1,124.86 | 1,404.93 | 2,529.79 | 8.30% | 1,259.71 | 1,259.71 | 2,519.42 | 8.00% |
| 4 | 1,169.86 | 1,573.52 | 2,743.38 | 8.44% | 1,360.49 | 1,360.49 | 2,720.98 | 8.00% |
| 5 | 1,216.65 | 1,762.34 | 2,978.99 | 8.59% | 1,469.33 | 1,469.33 | 2,938.66 | 8.00% |
| 6 | 1,265.32 | 1,973.82 | 3,239.14 | 8.73% | 1,586.87 | 1,586.87 | 3,173.75 | 8.00% |
| 7 | 1,315.93 | 2,210.68 | 3,526.61 | 8.87% | 1,713.82 | 1,713.82 | 3,427.65 | 8.00% |
| 8 | 1,368.57 | 2,475.96 | 3,844.53 | 9.01% | 1,850.93 | 1,850.93 | 3,701.86 | 8.00% |
| 9 | 1,423.31 | 2,773.08 | 4,196.39 | 9.15% | 1,999.00 | 1,999.00 | 3,998.01 | 8.00% |
| 10 | 1,480.24 | 3,105.85 | 4,586.09 | 9.29% | 2,158.92 | 2,158.92 | 4,317.85 | 8.00% |
| 11 | 1,539.45 | 3,478.55 | 5,018.00 | 9.42% | 2,331.64 | 2,331.64 | 4,663.28 | 8.00% |
| 12 | 1,601.03 | 3,895.98 | 5,497.01 | 9.55% | 2,518.17 | 2,518.17 | 5,036.34 | 8.00% |
| 13 | 1,665.07 | 4,363.49 | 6,028.57 | 9.67% | 2,719.62 | 2,719.62 | 5,439.25 | 8.00% |
| 14 | 1,731.68 | 4,887.11 | 6,618.79 | 9.79% | 2,937.19 | 2,937.19 | 5,874.39 | 8.00% |
| 15 | 1,800.94 | 5,473.57 | 7,274.51 | 9.91% | 3,172.17 | 3,172.17 | 6,344.34 | 8.00% |
| 16 | 1,872.98 | 6,130.39 | 8,003.37 | 10.02% | 3,425.94 | 3,425.94 | 6,851.89 | 8.00% |
| 17 | 1,947.90 | 6,866.04 | 8,813.94 | 10.13% | 3,700.02 | 3,700.02 | 7,400.04 | 8.00% |
| 18 | 2,025.82 | 7,689.97 | 9,715.78 | 10.23% | 3,996.02 | 3,996.02 | 7,992.04 | 8.00% |
| 19 | 2,106.85 | 8,612.76 | 10,719.61 | 10.33% | 4,315.70 | 4,315.70 | 8,631.40 | 8.00% |
| 20 | 2,191.12 | 9,646.29 | 11,837.42 | 10.43% | 4,660.96 | 4,660.96 | 9,321.91 | 8.00% |
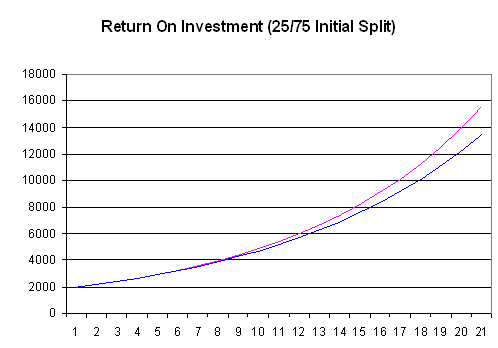
| Year | Bond | Stocks | Total | Return | Rebalance Bond | Rebalance Stock | New Total | Total Return |
|---|---|---|---|---|---|---|---|---|
| Start | 500.00 | 1,500.00 | 2,000.00 | 500.00 | 1,500.00 | 2,000.00 | ||
| 1 | 520.00 | 1,680.00 | 2,200.00 | 10.00% | 550.00 | 1,650.00 | 2,200.00 | 9.09% |
| 2 | 540.80 | 1,881.60 | 2,422.40 | 10.11% | 605.00 | 1,815.00 | 2,420.00 | 9.09% |
| 3 | 562.43 | 2,107.39 | 2,669.82 | 10.21% | 665.50 | 1,996.50 | 2,662.00 | 9.09% |
| 4 | 584.93 | 2,360.28 | 2,945.21 | 10.31% | 732.05 | 2,196.15 | 2,928.20 | 9.09% |
| 5 | 608.33 | 2,643.51 | 3,251.84 | 10.41% | 805.26 | 2,415.77 | 3,221.02 | 9.09% |
| 6 | 632.66 | 2,960.73 | 3,593.39 | 10.50% | 885.78 | 2,657.34 | 3,543.12 | 9.09% |
| 7 | 657.97 | 3,316.02 | 3,973.99 | 10.59% | 974.36 | 2,923.08 | 3,897.43 | 9.09% |
| 8 | 684.28 | 3,713.94 | 4,398.23 | 10.68% | 1,071.79 | 3,215.38 | 4,287.18 | 9.09% |
| 9 | 711.66 | 4,159.62 | 4,871.27 | 10.76% | 1,178.97 | 3,536.92 | 4,715.90 | 9.09% |
| 10 | 740.12 | 4,658.77 | 5,398.89 | 10.83% | 1,296.87 | 3,890.61 | 5,187.48 | 9.09% |
| 11 | 769.73 | 5,217.82 | 5,987.55 | 10.90% | 1,426.56 | 4,279.68 | 5,706.23 | 9.09% |
| 12 | 800.52 | 5,843.96 | 6,644.48 | 10.97% | 1,569.21 | 4,707.64 | 6,276.86 | 9.09% |
| 13 | 832.54 | 6,545.24 | 7,377.78 | 11.04% | 1,726.14 | 5,178.41 | 6,904.54 | 9.09% |
| 14 | 865.84 | 7,330.67 | 8,196.51 | 11.10% | 1,898.75 | 5,696.25 | 7,595.00 | 9.09% |
| 15 | 900.47 | 8,210.35 | 9,110.82 | 11.15% | 2,088.62 | 6,265.87 | 8,354.50 | 9.09% |
| 16 | 936.49 | 9,195.59 | 10,132.08 | 11.21% | 2,297.49 | 6,892.46 | 9,189.95 | 9.09% |
| 17 | 973.95 | 10,299.06 | 11,273.01 | 11.26% | 2,527.24 | 7,581.71 | 10,108.94 | 9.09% |
| 18 | 1,012.91 | 11,534.95 | 12,547.86 | 11.31% | 2,779.96 | 8,339.88 | 11,119.83 | 9.09% |
| 19 | 1,053.42 | 12,919.14 | 13,972.57 | 11.35% | 3,057.95 | 9,173.86 | 12,231.82 | 9.09% |
| 20 | 1,095.56 | 14,469.44 | 15,565.00 | 11.40% | 3,363.75 | 10,091.25 | 13,455.00 | 9.09% |
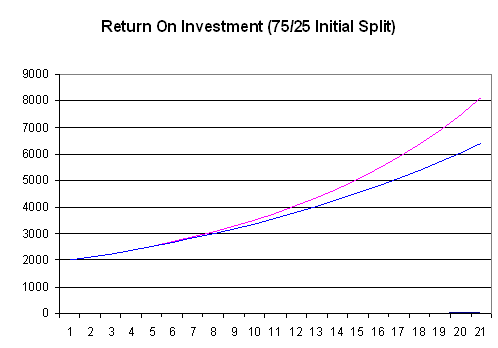
| Year | Bond | Stocks | Total | Return | Rebalance Bond | Rebalance Stock | New Total | Total Return |
|---|---|---|---|---|---|---|---|---|
| Start | 1,500.00 | 500.00 | 2,000.00 | 1,500.00 | 500.00 | 2,000.00 | ||
| 1 | 1,560.00 | 560.00 | 2,120.00 | 6.00% | 1,590.00 | 530.00 | 2,120.00 | 6.00% |
| 2 | 1,622.40 | 627.20 | 2,249.60 | 6.11% | 1,685.40 | 561.80 | 2,247.20 | 6.00% |
| 3 | 1,687.30 | 702.46 | 2,389.76 | 6.23% | 1,786.52 | 595.51 | 2,382.03 | 6.00% |
| 4 | 1,754.79 | 786.76 | 2,541.55 | 6.35% | 1,893.72 | 631.24 | 2,524.95 | 6.00% |
| 5 | 1,824.98 | 881.17 | 2,706.15 | 6.48% | 2,007.34 | 669.11 | 2,676.45 | 6.00% |
| 6 | 1,897.98 | 986.91 | 2,884.89 | 6.60% | 2,127.78 | 709.26 | 2,837.04 | 6.00% |
| 7 | 1,973.90 | 1,105.34 | 3,079.24 | 6.74% | 2,255.45 | 751.82 | 3,007.26 | 6.00% |
| 8 | 2,052.85 | 1,237.98 | 3,290.84 | 6.87% | 2,390.77 | 796.92 | 3,187.70 | 6.00% |
| 9 | 2,134.97 | 1,386.54 | 3,521.51 | 7.01% | 2,534.22 | 844.74 | 3,378.96 | 6.00% |
| 10 | 2,220.37 | 1,552.92 | 3,773.29 | 7.15% | 2,686.27 | 895.42 | 3,581.70 | 6.00% |
| 11 | 2,309.18 | 1,739.27 | 4,048.46 | 7.29% | 2,847.45 | 949.15 | 3,796.60 | 6.00% |
| 12 | 2,401.55 | 1,947.99 | 4,349.54 | 7.44% | 3,018.29 | 1,006.10 | 4,024.39 | 6.00% |
| 13 | 2,497.61 | 2,181.75 | 4,679.36 | 7.58% | 3,199.39 | 1,066.46 | 4,265.86 | 6.00% |
| 14 | 2,597.51 | 2,443.56 | 5,041.07 | 7.73% | 3,391.36 | 1,130.45 | 4,521.81 | 6.00% |
| 15 | 2,701.42 | 2,736.78 | 5,438.20 | 7.88% | 3,594.84 | 1,198.28 | 4,793.12 | 6.00% |
| 16 | 2,809.47 | 3,065.20 | 5,874.67 | 8.03% | 3,810.53 | 1,270.18 | 5,080.70 | 6.00% |
| 17 | 2,921.85 | 3,433.02 | 6,354.87 | 8.17% | 4,039.16 | 1,346.39 | 5,385.55 | 6.00% |
| 18 | 3,038.72 | 3,844.98 | 6,883.71 | 8.32% | 4,281.51 | 1,427.17 | 5,708.68 | 6.00% |
| 19 | 3,160.27 | 4,306.38 | 7,466.65 | 8.47% | 4,538.40 | 1,512.80 | 6,051.20 | 6.00% |
| 20 | 3,286.68 | 4,823.15 | 8,109.83 | 8.61% | 4,810.70 | 1,603.57 | 6,414.27 | 6.00% |
Assuming we do know what a good balanced asset allocation is, how do we know we can actually find any good deals in those classes, never mind great deals? How do we know we can again find the same percentages of good deal each and every year when we need to rebalance our portfolio? Sometimes stocks are overpriced, other times bonds are a bad investment… The same can be said for all investment classes and vehicles. Maybe it’s sector based, maybe industry, maybe equity based, etc. How can you know that you will find good deals year over year in each of your asset classes for the percentages you need? If you look at Warren Buffett, who doesn’t really limit himself in terms of investment classes other than those he can understand, he has often been found to say that there are no good investments at this time. Therefore he would rather hold cash with a very low return than buy assets that are underperforming, he’d rather wait for that great deal because the return on investment is worth it many times over! Here you would be forcing your hand because you decided that x% of your assets should be allocated in this type of investment versus that type, whether it’s a good deal or not.
So far we know that we don’t really know how to split up our investment appropriately and that it’s highly unlikely we’ll find good deals each year in all our asset classes (stocks, bonds, etc.) for the rebalancings that we enforce upon ourselves. But what about the extra commission costs each year to re-allocate our assets? If I buy a stock that’s performing well for 5-10 years, as long as I don’t sell it, I don’t pay any commissions or taxes! With an value based portfolio I assume a minimum holding period of 3-10 years (Buffett suggests an infinite holding period) which I myself generally do (the only time I sold my stocks was to cash out to start my company LandlordMax). Going back to commissions, yes, this is a small amount but it does add up if you do it each and every year over multiple trades. Let’s assume a 1% commission rate, that means that each year you lose 1%. Compound that over time and it quickly adds up. 1% over 20 years compounded on a compounded amount is a lot.
What hits you harder though is capital appreciation taxes when rebalancing each year. Since I’ve already written about the drastic affects capital appreciation taxes can have, I’ll only write a small quick example and let you refer to my prior article for the details. Assuming you bought $10,000 shares of company xyz with a 12% rate of return, after year 1 you’d have $11,200. Depending on how many you need to sell to balance your portfolio, you’ll need to pay taxes on those gains. Assuming you need to sell $1000 to rebalance your portfolio with a 36% tax rate, you’ll lose $360 of your gains. That’s $360 that can’t be compounded each year just because your portfolio didn’t match your exact percentages! And remember this number will drastically increase as the size of your portfolio does.
Alright, now that we know the simple reasons, let’s look at the last and most important reason of why. Each time you rebalance your portfolio, you’re in essence trading some of your best performing assets for some more of your worst performing assets. To put it in another way, you’re selling your best performing asset to buy more of your worse performing asset. If I ever heard of a bad way to make money, this would be it! In business you generally try to shed away your worse business units. In real estate you generally try to sell your low cashflow (or cashflow negative) properties. In a balanced portfolio you’re trying to get rid of some of your best performing investments to invest more money into your worst performing ones. That makes no sense to me!!!
I know that for some of you this might not be intuitive, so let’s look at the details, let’s crunch some numbers. Now before I begin, I’ll just let you know that all these numbers have some assumptions for simplicity. All the example below assume a portfolio of two assets, stocks and bonds. They assume a 4% rate of return on bonds (near today’s rate) and a 12% rate of return for stocks. The timeline is also assumed to be 20 years, except for the final example which is for 50 years.
So what I did to crunch the number is try 3 different ways to balance a portfolio of stocks and bonds. I worked out 75%/25%, 50%/50%, and 25%/75% splits. In every single scenario the balanced portfolio made less money. Please note also that none of the scenarios took into consideration the extra losses due to commissions and especially to capital appreciation taxes, as we mentioned above. Therefore in reality the discrepency would be even larger!
Anyways, looking at the numbers, what I found is that if you start a portfolio with a specific balance and let it play out, over time it will increase it’s rate of return to that of the best performing asset. This makes perfect sense because that asset will take up a larger and larger percentage of your total portfolio. To give an example, if you start with a 25% stock and 75% bond allocation, over time the stocks will become a larger and larger percentage of your total portfolio (for those of you who are mathematicians, if you do a limit to infinity eventually the stocks will approach 100% of the portfolio as they’ll completely dwarf the bonds in size). Using our above assumptions, after 15 years stocks become more than 50% of the portfolio ($2,736.78 versus $2,701.42 for bonds). After 50 years, assuming a starting balance of $500 in stocks and $1500 in bonds, the difference is a 14 to 1 ratio! The balance becomes $144,501.09 in stocks and $10,660.03 for bonds. A very large discrepency!
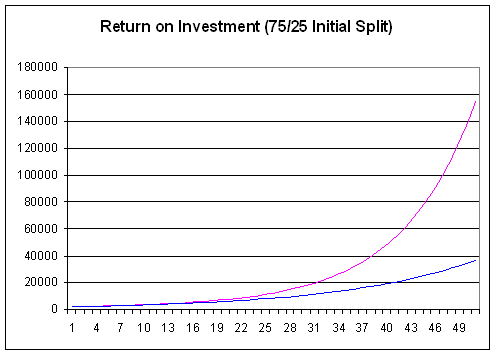
| Year | Bond | Stocks | Total | Return | Rebalance Bond | Rebalance Stock | New Total | Total Return |
|---|---|---|---|---|---|---|---|---|
| Start | 1,500.00 | 500.00 | 2,000.00 | 1,500.00 | 500.00 | 2,000.00 | ||
| 1 | 1,560.00 | 560.00 | 2,120.00 | 6.00% | 1,590.00 | 530.00 | 2,120.00 | 6.00% |
| 2 | 1,622.40 | 627.20 | 2,249.60 | 6.11% | 1,685.40 | 561.80 | 2,247.20 | 6.00% |
| 3 | 1,687.30 | 702.46 | 2,389.76 | 6.23% | 1,786.52 | 595.51 | 2,382.03 | 6.00% |
| 4 | 1,754.79 | 786.76 | 2,541.55 | 6.35% | 1,893.72 | 631.24 | 2,524.95 | 6.00% |
| 5 | 1,824.98 | 881.17 | 2,706.15 | 6.48% | 2,007.34 | 669.11 | 2,676.45 | 6.00% |
| 6 | 1,897.98 | 986.91 | 2,884.89 | 6.60% | 2,127.78 | 709.26 | 2,837.04 | 6.00% |
| 7 | 1,973.90 | 1,105.34 | 3,079.24 | 6.74% | 2,255.45 | 751.82 | 3,007.26 | 6.00% |
| 8 | 2,052.85 | 1,237.98 | 3,290.84 | 6.87% | 2,390.77 | 796.92 | 3,187.70 | 6.00% |
| 9 | 2,134.97 | 1,386.54 | 3,521.51 | 7.01% | 2,534.22 | 844.74 | 3,378.96 | 6.00% |
| 10 | 2,220.37 | 1,552.92 | 3,773.29 | 7.15% | 2,686.27 | 895.42 | 3,581.70 | 6.00% |
| 11 | 2,309.18 | 1,739.27 | 4,048.46 | 7.29% | 2,847.45 | 949.15 | 3,796.60 | 6.00% |
| 12 | 2,401.55 | 1,947.99 | 4,349.54 | 7.44% | 3,018.29 | 1,006.10 | 4,024.39 | 6.00% |
| 13 | 2,497.61 | 2,181.75 | 4,679.36 | 7.58% | 3,199.39 | 1,066.46 | 4,265.86 | 6.00% |
| 14 | 2,597.51 | 2,443.56 | 5,041.07 | 7.73% | 3,391.36 | 1,130.45 | 4,521.81 | 6.00% |
| 15 | 2,701.42 | 2,736.78 | 5,438.20 | 7.88% | 3,594.84 | 1,198.28 | 4,793.12 | 6.00% |
| 16 | 2,809.47 | 3,065.20 | 5,874.67 | 8.03% | 3,810.53 | 1,270.18 | 5,080.70 | 6.00% |
| 17 | 2,921.85 | 3,433.02 | 6,354.87 | 8.17% | 4,039.16 | 1,346.39 | 5,385.55 | 6.00% |
| 18 | 3,038.72 | 3,844.98 | 6,883.71 | 8.32% | 4,281.51 | 1,427.17 | 5,708.68 | 6.00% |
| 19 | 3,160.27 | 4,306.38 | 7,466.65 | 8.47% | 4,538.40 | 1,512.80 | 6,051.20 | 6.00% |
| 20 | 3,286.68 | 4,823.15 | 8,109.83 | 8.61% | 4,810.70 | 1,603.57 | 6,414.27 | 6.00% |
| 21 | 3,418.15 | 5,401.92 | 8,820.08 | 8.76% | 5,099.35 | 1,699.78 | 6,799.13 | 6.00% |
| 22 | 3,554.88 | 6,050.16 | 9,605.03 | 8.90% | 5,405.31 | 1,801.77 | 7,207.07 | 6.00% |
| 23 | 3,697.07 | 6,776.17 | 10,473.25 | 9.04% | 5,729.62 | 1,909.87 | 7,639.50 | 6.00% |
| 24 | 3,844.96 | 7,589.31 | 11,434.27 | 9.18% | 6,073.40 | 2,024.47 | 8,097.87 | 6.00% |
| 25 | 3,998.75 | 8,500.03 | 12,498.79 | 9.31% | 6,437.81 | 2,145.94 | 8,583.74 | 6.00% |
| 26 | 4,158.70 | 9,520.04 | 13,678.74 | 9.44% | 6,824.07 | 2,274.69 | 9,098.77 | 6.00% |
| 27 | 4,325.05 | 10,662.44 | 14,987.49 | 9.57% | 7,233.52 | 2,411.17 | 9,644.69 | 6.00% |
| 28 | 4,498.05 | 11,941.93 | 16,439.99 | 9.69% | 7,667.53 | 2,555.84 | 10,223.37 | 6.00% |
| 29 | 4,677.98 | 13,374.97 | 18,052.94 | 9.81% | 8,127.58 | 2,709.19 | 10,836.78 | 6.00% |
| 30 | 4,865.10 | 14,979.96 | 19,845.06 | 9.93% | 8,615.24 | 2,871.75 | 11,486.98 | 6.00% |
| 31 | 5,059.70 | 16,777.56 | 21,837.26 | 10.04% | 9,132.15 | 3,044.05 | 12,176.20 | 6.00% |
| 32 | 5,262.09 | 18,790.86 | 24,052.95 | 10.15% | 9,680.08 | 3,226.69 | 12,906.77 | 6.00% |
| 33 | 5,472.57 | 21,045.77 | 26,518.34 | 10.25% | 10,260.88 | 3,420.29 | 13,681.18 | 6.00% |
| 34 | 5,691.47 | 23,571.26 | 29,262.73 | 10.35% | 10,876.54 | 3,625.51 | 14,502.05 | 6.00% |
| 35 | 5,919.13 | 26,399.81 | 32,318.94 | 10.44% | 11,529.13 | 3,843.04 | 15,372.17 | 6.00% |
| 36 | 6,155.90 | 29,567.79 | 35,723.69 | 10.53% | 12,220.88 | 4,073.63 | 16,294.50 | 6.00% |
| 37 | 6,402.13 | 33,115.92 | 39,518.06 | 10.62% | 12,954.13 | 4,318.04 | 17,272.17 | 6.00% |
| 38 | 6,658.22 | 37,089.83 | 43,748.05 | 10.70% | 13,731.38 | 4,577.13 | 18,308.50 | 6.00% |
| 39 | 6,924.55 | 41,540.61 | 48,465.16 | 10.78% | 14,555.26 | 4,851.75 | 19,407.01 | 6.00% |
| 40 | 7,201.53 | 46,525.49 | 53,727.02 | 10.86% | 15,428.58 | 5,142.86 | 20,571.44 | 6.00% |
| 41 | 7,489.59 | 52,108.54 | 59,598.14 | 10.93% | 16,354.29 | 5,451.43 | 21,805.72 | 6.00% |
| 42 | 7,789.18 | 58,361.57 | 66,150.74 | 10.99% | 17,335.55 | 5,778.52 | 23,114.07 | 6.00% |
| 43 | 8,100.74 | 65,364.96 | 73,465.70 | 11.06% | 18,375.68 | 6,125.23 | 24,500.91 | 6.00% |
| 44 | 8,424.77 | 73,208.75 | 81,633.52 | 11.12% | 19,478.22 | 6,492.74 | 25,970.96 | 6.00% |
| 45 | 8,761.76 | 81,993.80 | 90,755.57 | 11.17% | 20,646.92 | 6,882.31 | 27,529.22 | 6.00% |
| 46 | 9,112.23 | 91,833.06 | 100,945.29 | 11.23% | 21,885.73 | 7,295.24 | 29,180.97 | 6.00% |
| 47 | 9,476.72 | 102,853.03 | 112,329.75 | 11.28% | 23,198.88 | 7,732.96 | 30,931.83 | 6.00% |
| 48 | 9,855.79 | 115,195.39 | 125,051.18 | 11.33% | 24,590.81 | 8,196.94 | 32,787.74 | 6.00% |
| 49 | 10,250.02 | 129,018.83 | 139,268.86 | 11.37% | 26,066.26 | 8,688.75 | 34,755.01 | 6.00% |
| 50 | 10,660.03 | 144,501.09 | 155,161.12 | 11.41% | 27,630.23 | 9,210.08 | 36,840.31 | 6.00% |
As you saw in the examples above, in each and every case the balanced portfolio falls behind the unbalanced portfolio. The numbers don’t lie! I challenge you to try to find a balanced portfolio that will beat an unbalanced portfolio over 20 years (assuming an even allocation of assets at the beginning, so for example if you use stocks and bonds only, the portfolio would start with 50% stocks and 50% bonds). Of course I’ll want to see the numbers and the details, but if you do I will post a full entry about it giving you full credit, it won’t just be post in the comments! I’m so sure of this that I’ll even offer a free copy of LandlordMax Property Management Software to the first person who can find an example where a balanced portfolio will beat an unbalanced portfolio over 20 years!
Before I finish, let me leave you with a few additional thoughts. A balanced portfolio assumes that you’re qualified to find deals in all your different asset classes (stocks, bonds, etc.). I personally don’t believe anyone can find deals in all asset classes, it’s just too much information for any one person to know. I also personally believe that you should only invest in what you know and understand well, no matter what the investment class it is. By having a balanced portfolio, you’re forcing yourself to invest in asset classes that might not be right for you or that you have limited knowledge in.
Another quick note about the balanced portfolio investment style is that it assumes the market is efficient. The reality is that this is simply not true! Markets are not efficient, there are emotions and speculation. Anyone want to explain the dot com boom and bust in terms of an efficient market? I think not! The reality is that the market is not efficient because there are always deals to be had. Just like in the real estate market, there are always good and bad opportunities.
In any case, to finish up as I could point out several other issues I have with the balanced portfolio investment style, I think you can already see why it’s not an optimal investment strategy. The whole reason it was invented was not to be optimal but rather to reduce volatily! Don’t ever forget that! Only use this investment method if that’s your goal, don’t use it for any other reason.


· September 19th, 2006 · 8:52 pm · Permalink
Hello Steph,
Great points, great numbers.
You are right. Asset allocation is premised on reducing volatility and chances of greater losses. Investing in a different asset class when one runs up. (Which usually is followed by a correction)
A way to participate in the theory of asset allocation and reduce transaction fees, and capital gains taxes, is to use new money to invest in the “lagging” class.
IE: You usually invest $3000/year. This year your $3000 goes into bonds, as the equities portion has gotten out of synch.
Asset allocation is a simple way to explain and reinforce the consumer that they need to look at whether their investments still fit their plans going forward. It is not as important to fit the rigid percentages prescribed by such and such a plan, but to know the reasons behind it, your personal goals, and timeline for your investment.
Had some Nortel, to name a sore point, and other tech savvy investors taken an asset allocation peek at their portfolio in they hay days of the tech boom… many of them would be sitting on a very comfortable, boring “non performing” real-estate/bond/”tech” equities portfolio in the 6 figures! Unfortunately, in those days few listened and now sit on a basket of tech stocks that barely make an interesting dinner party discussion.
Not all investment theories and styles fit everyone. (As you stated very clearly in your article.) Some, dare I say many, don’t understand the markets well enough to manage their own portfolios and can be served by the various products that are available. Granted not the best way to riches, but a much better result then stuffing their pillows with “what’s left at the end of the month” or investing strictly in Canada Savings or Victory Bonds.
· September 19th, 2006 · 10:29 pm · Permalink
Hi Eric,
You’re right, it’s not for everyone. For those who don’t know anything about investments, or aren’t interested, I would simply suggest you invest in index funds. Those are the simplest and easiest to understand, and get an average return (they ARE the average).
However if you’re looking at a balanced portfolio, as you suggested, when you have $3000 that needs to be re-invested, then where should it go? I would say into your best performing asset.
Now please note that the best performing asset, which I didn’t really specify what that is, is NOT based on the capital appreciation! That is, you should not buy stocks into those that have increased in price the most!!!
Prices and intrinsic value are two completely different things. I believe you should be buying those stocks that have increased the most in their intrinsic value, NOT stock price!!!
I don’t want to push a sore point either, but the thing to remember is that when Nortel was selling at it’s high point, looking at it from a value investment perspective, it made no sense. I remember at one point, this is near it’s low, it was selling for a $1/share while losing $5/share in earnings! That’s insane! Who would buy a corner store that was for $100,000 that was losing $500,000 a year? But people all around me who were used to the sky high prices at the time were still flocking to Nortel because it was so cheap now… What!?! To me it was still way too expensive (the balance sheet was just as terrible at the time, if not worse)!
The problem with Nortel is that it was bought mainly on speculation and hearsay. I can tell you that of everyone I know who bought it here in Canada (it was very popular in Canada), not one person actually knew it’s intrinsic value. Not one person could actually give me any real numbers at all. They were all riding the wave of speculation. Now I’m not saying this is true of you too, I’m just saying these were my observations.
Also note that I bought the majority of my stocks holdings just as the dot com crash was starting and continued to do so until I cashed out everything to start LandlordMax Property Management Software. And I can tell you many people thought I was insane buying stocks as they were tanking hard. But I bought them based on solid fundamentals, and I made a good deal of money this way. I knew that based on the fundamentals the companies I chose would prosper.
I don’t really mean to be on a soapbox, but too many people keep pointing Nortel out to me here in Canada because they lost money on it. The reality is that very few actually knew anything about that stock, and if that’s the case, then you’re absolutely right, you shouldn’t be balancing your portfolio. You don’t have the knowledge, pure and simple. You should then be looking at index funds.