
Should You Use a Code Profiler?
If you’re a software developers, absolutely!!! No doubt about it!
Before I go on, let me just take a step back to explain what a code profiler is to those that aren’t familiar with the term since a lot of you here also aren’t software developers. And surprisingly, a lot of software developers have no idea what a code profiler is!
A code profiler is a software application that helps you find performance bottlenecks, pin down memory leaks and resolve threading issues in your software application. So in other words, it’s a tool that helps you find where your own software needs the most improvement.
You would think that with today’s amazingly fast machines you wouldn’t need to worry so much about performance or memory (threading is something you always have to worry about). Yes, that’s partially true, but not always! For LandlordMax, as the database becomes progressively larger, so does the importance of running a code profiler. As some of you may have noticed, we’ve really been pushing performance enhancements recently (for example: here and here), and there’s a reason why. When we initially ran our tests, we ran them with fairly large databases, but we’d only test one section at a time. Lately we’ve been really pushing the envelop, creating databases that are larger than any of our customers will ever have, and we’ve noticed some performance issues with these massive databases, as well as some memory issues.
So then the question becomes, why not just optimize everything? Because that’s incredibly time consuming and very expensive. But more importantly, it’s often a waste of time and money. Most of the improvements you’ll do won’t make any noticeable difference. For example, if a screen refreshes in 10ms versus 20ms, no one will notice, it’s too fast to be perceptible, even if it’s a doubling in speed! However the cost of this improvement may be significant, hence driving up the cost of the software! No one wants this, and there’s no real benefit to anyone in this case.
So what we’re left with is focusing on the main performance bottlenecks. How do we do this? Most people will think that you just look at code, it should be obvious. It’s not! Often where you think there’s a bottleneck is just plain wrong. This is one of the hardest things to do!
So where does this leave us? How do we do this? We could integrate within our application a bunch of timers, memory readouts, etc. that would continually post information out to the screen. I’d suggest against this because this is very time consuming, error prone, has the high probability of introducing unncessary bugs, and adds a lot of extra code to your application.
A better solution is to use a code profiling application. As LandlordMax is Java based, I can only talk about the Java code profiling application. There’s 4 main software solutions, all ranging greatly in price, how they tackle the problem of profiling, what features they offer, etc. They are: JProfiler, YourKit, OptimizeIt, and JProbe.
After some analysis, I narrowed our list of options down to either JProfiler or YourKit. I simply couldn’t justify the cost of OptimizeIt, and JProbe seemed still stuck back about a decade in terms of GUI (it just wasn’t friendly to work with at all).
I did personally contact both of the companies I was interested in evaluating (JProfiler and YourKit) and told them I was going to write a review here on FollowSteph.com about this topic. Both were enthusiastic about it, and each was willing to provide me with a free license to their application (thank you!) so that I could really try out their software packages. It’s great to see this kind of enthusiasm! It’s also great to see companies that really believe in their products!
That being said, after some experimenting, I’m going to say that I prefer JProfiler. YourKit was nice, but I found JProfiler’s interface much more intuitive, it provided me the information I needed in a very organized and obvious manner. This made finding the bottlenecks and memory issues much faster and easier! Therefore in my opinion, although both tools are powerful, but I recommend JProfiler as the better alternative.
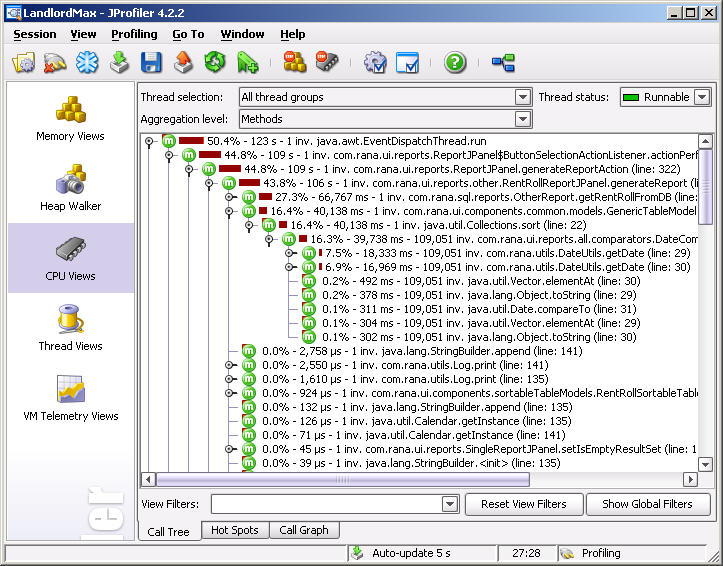
To give you a few examples of some of the phenomenal improvements we got with LandlordMax, before we started using JProfiler, we ran a rent roll report that generated 521 pages of rents due (that’s a big database!) in less than 14 minutes. That seemed reasonable to us when you consider the size of the report. This same report now runs on my computer in 12 seconds!!! Yes you read that right, in 12 seconds! When we ran it with JProfiler, the performance bottleneck jumped right out at us. It was not at all where we thought it was, we had been focusing on the wrong area of code. Had we not used JProfiler for this, we could have spent many more hours, possibly days, trying to improve the performance and it would have only been minor, maybe we would have shredded one minute from the total time, nothing like what we achieved.
Also, remember that the time cost to fix this was extremely small, once we saw it in the “CPU Views” section, it was a no-brainer. Solving it wasn’t obvious, but locating the source of the issue was! Much like locating the leak in a pipe can be brutal, but once you know where it is, solving it isn’t nearly as difficult. With JProfiler we were able to find it in seconds, with just one pass of the report.
Although I’ve been mostly mentioning performance bottlenecks, memory leaks (or extraneous usage) can and also does happen. While running JProfiler we also found that we used more memory than necessary in many places. We immediately saw that our “instance” count was extremely high for Vector Objects (a Java library object that stores a list of other objects). Why was our instance count so high? By quickly drilling down JProfiler’s Call Tree, we immediately noticed the issue.
What was happening is that for each Model Object we created (a chunk of programming code that represents either a real world object or a concept), we were pre-creating several empty Vectors (lists). I know that without a context this doesn’t make much sense, so let’s give it a context. So for example, when we created a new Building Object, we would pre-create an empty Vector (list) of units, of accounting entries, and every other item that might be in the tabbed panels. There’s nothing wrong with that. When we were in the list view (where you would only see the list of buildings without the details), we only populated the basic building information so that it could be drawn in the table, not the full data (the list of accounting entries, etc.). We didn’t populate these lists (accounting entries, etc.) for every building because you might never view most of the buildings every time. Why take the performance and memory hit to pre-populate all the data if you probably will only use a small portion of it. Therefore we’d only populate the lists (accounting entries, etc.) for a building when that building was selected. This way, only when we actually look at the details of a building do we put information in our Vector Objects (accounting entries, etc.).
So how can there be a memory leak here? Well there isn’t one really. But what happens is that when we created a new Building we’d also create several empty lists (accounting entries, etc.) by creating a new Vector Object with no items in it. Still don’t see where the memory leak is? To be honest in retrospect it’s really obvious, but at the time I hadn’t really thought of it. The memory leak is that each of those empty Vectors Objects take memory. Each Vector Object has to be created (instantiated and allocated). Although the list contains nothing, the Vector Object does take up space. If you only have a few hundred buildings, it’s almost unoticeable. But now imagine that you have thousands of buildings, each with about a dozen empty Vector Objects! What about if you run a rent roll report like the one above with 521 pages of Objects each containing a dozen or so empty Vector Objects (lists)!
I wasn’t even looking for a memory issue in this area of the code, but by just running JProfiler while performing some random tasks quickly brought this to my attention. Of course, I had I run LandlordMax with a database of only a few hundred buildings I probably wouldn’t have noticed anything. You see in Object Oriented Languages such as Java, almost everything is an Object, there’s lots of Objects. Each Screen is an Object itself composed of many other Objects (Button Objects, Label Objects, etc.). There are Objects everywhere. But in this case because the database was much larger, the Object count quickly got out of proportion and it became very obvious when looking at the metrics within JProfiler.
So to fix this little issue, all we had to do is go from created empty Vectors (lists) to using lazy instantiation. What that means is that we don’t even create an empty Vector, all we basically do is say this is where the list will go in memory. We don’t actually put a list there, not even an empty one. In Java, we assign it the value of “null”. Without getting too technical, variables generally point to the Object in memory, they don’t store the actual Object (pass by reference rather than pass by value). So when we put “null”, we don’t need to worry about allocating that Vector Object right now, we can deal with it later if need be (or never if we don’t need to). if you want more details this article explains it in a lot more detail. Anyways, doing this greatly reduced the amount of memory we used everywhere. Had I not run a code profiler like JProfiler, I don’t think I would have noticed this. It’s not a show stopper, but the less memory your software uses the better, and generally the faster it is. It didn’t need to create and destroy all these empty Vector object instances for nothing.
Another great benefit we quickly got with JProfiler is that it showed us our data entry screens needed some performance boosts. Up until now, we generally focused on the list views, as those are the ones that contain the biggest amount of data. But JProfiler quickly brought to our attention that the combo boxes can be performance issues. For example, when I go to create a new accounting entry where the database contains over 2000 tenants, 2000 buildings, 2000 vendors, etc., each of these respective combo boxes need to be redrawn (in case any data updates were made). Each combo box requires a database call. Each combo box requires some Objects to be created and destroyed as they are updated. This quickly added up and became really apparent with a large database just by looking at the screens within JProfiler.
Because of this, we’ve now added some caching to LandlordMax which will be available in the next major release. As I mentioned earlier in this article, we could have cached everything, but because of JProfiler we focused on only caching the combo boxes that had performance and memory bottlenecks (which ended up only being 5 combo boxes). Talk about a time saver! I can’t imagine having created caching for everything! By analyzing the metrics, we found that 99% of the performance bottlenecks could be attributed to only 5 combo boxes, which is a lot less than hundreds of potential combo boxes, labels, prefilled data entry fields, etc.
As a quick side note, those of you who aren’t familiar, caching is a way of storing information in memory so that it doesn’t have to be retrieved from the database each time (and also a way of re-using the same Object instances rather than re-creating new ones each time). Because of this, if no changes occur between screens (for example no tenants are added, removed, or modified), the combo box is virtually instantaneously drawn and consumes no extra memory. If a change do occur (a tenant’s name is modified, etc.), we now just update the cached tenant list so that it still doesn’t require a full database call or the creation of new objects. If you have thousands of tenants, buildings, units, vendors, etc., this can quickly add up.
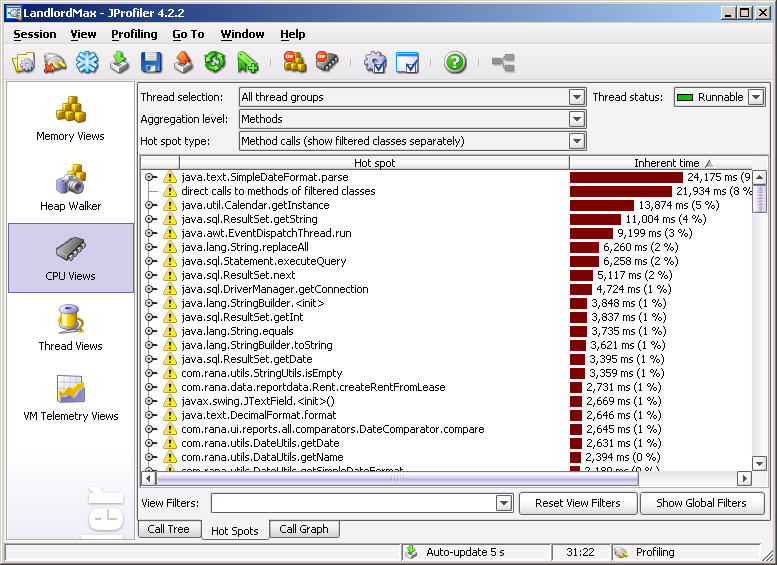
Before I finish this article, I just wanted to point out JProfiler’s “Hot Spot” functionality which is available for memory and performance analysis. This is basically a feature within the software that tries to actively point out to you where the bottlenecks are, so that you don’t have to look any further. Think of it as a summary of where you should look next, where you should look to enhance your software. It’s a nice little feature. Now that I think about it, it’s almost like it generates a “to do” list for you on where you should focus your time and money to enhance performance.
So have I convinced you that you (at least you software developers and software company owners) that you should run a code profiler for your software application if you haven’t already done so? I hope so! These were only some of the highlights we got from using JProfiler, there were others (I didn’t even mention any of it’s thread analyzing capabilities!). As you can tell, I really benefited from using JProfiler, so I definitely recommend them, especially if you’re coding in Java. The value in terms of time, cost, and benefits is definitely worth it!


· October 6th, 2006 · 9:47 pm · Permalink
Great article! I have been debating with myself whether class-level objects should be instantiated where they are declared or where they are actually used. I don’t have tons of experience with programming so I had not considered lazy instantiation.
I am curious how you approach creating test databases, especially larger ones. Did you create a few properties and then copy them many times or write random stuff into the databases, or did you try to create more realistic datasets? Perhaps you took a combination of approaches?
· October 6th, 2006 · 10:44 pm · Permalink
Hi Ryan,
First, thanks! I’m glad you enjoyed the article.
In regards to lazy instantiation, I generally use “eager instantiation” when I want a pre-set default value, or the object is a primitive in Java. Otherwise I try to use lazy instantiation if it doesn’t look too costly in terms of coding effort (which sometimes it is). If it looks like it will be a little more complex to use lazy instantiation then I shortcut and use eager instantiation and just let a code profiler such as JProfiler let me know where I should tweak the code. Why go through all the trouble when 90+% of the time it won’t make any niticeable difference 😉
As for test database, we created some database generating scripts. For example, for tenants we randomly pick a first and last name from a list of the top 1000 firstnames and top 1000 lastnames accross North America. As for addresses, we just took a list of all the streets from one city and randomly append a street number. Mostly what we do is try to grab realistic data and include some randomness into it so that we can have much better testcases!
Don’t get me wrong, creating all the test database scripts took some time initially, but what’s great about it now is that we can create new fairly random databases that contain real world looking data. And sometimes this brings forth issues that we might not have thought about before!
· November 8th, 2006 · 10:06 pm · Permalink
[…] As well, we’ve done a lot of very significant performance enhancements. Between version 2.12b and version 2.12c we initially did some amazing performance enhancements, as much as an order of magnitude faster for many screens (that’s 10x faster performance!). Well in this version we did another order of magnitude in performance for most data and list screens! We ran a test database with over 2000 tenants, over 2000 units, over 5000 workorders, over 5000 receipts and invoices, over 50,000 accounting entries, and all the related data. I can assure you that the larger your database, the more significant the performance enhancements! Some screens have improvements where the display is virtually instantenous for larger tables (under 1/2 second)! We’ve improved the speed of the UI (User Interface) and the database calls (which I’ll probably write about the later very shortly). All in all, there are some very significant performance enhancements in this upcoming version! […]
· November 19th, 2006 · 2:54 pm · Permalink
[…] Since I wrote about JProfiler here on my blog, the people who make this amazing software contacted me to tell me about their installer solution called Install4J. After a few emails with them, I decided to give it a test run, and boy am I glad I did!!! They’ve created an amazing installer that’s in the same league as their code profiler! Within 1 hour I had created a brand new and fully functional installer for LandlordMax, including time to read a couple of advance features in the user manual! That’s amazing! Not only that, but if you consider the human resource costs of learning an installer like NSIS and the cost of Install4J, Install4J wins hands down! […]
· January 2nd, 2008 · 5:28 pm · Permalink
Opps, disappeared, ones more:
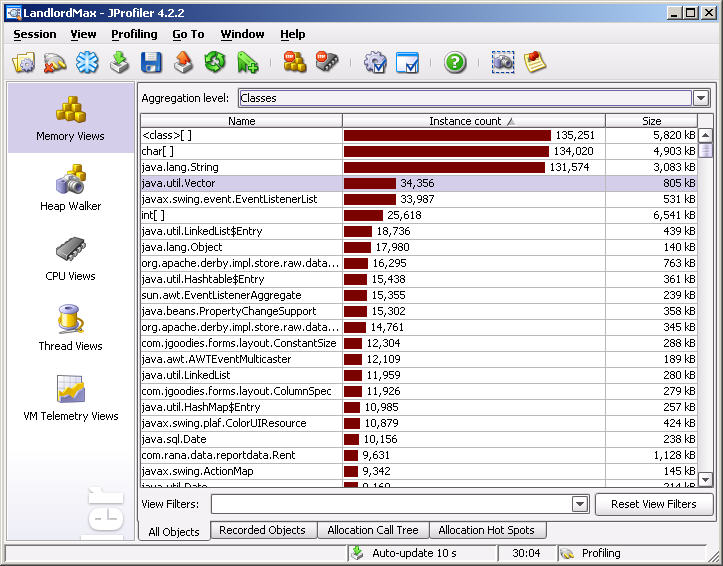
Does sy have information about what means <class>[] in the primitive type list?
· January 3rd, 2008 · 12:06 pm · Permalink
Hi AndR,
I’m not sure I correctly understand what you’re asking… Would you mind rephrasing it differently, and possibly adding an example?
· January 3rd, 2008 · 12:35 pm · Permalink
Hi,
If you see the second picture, in the memory views / All object list you can see the first row with this type.
I would like to know what this type means.
Thanks!
· January 3rd, 2008 · 4:36 pm · Permalink
If I remember correctly this is the specific object arrays. So for example if we have an array of Tenant[] than it would be in here.
At least that’s what I think it was. It’s been too long. We generally go through the profiler for each major release so in between I sometimes forget some of the details. We focus mainly on optimizing the main bottlenecks instead of spending a lot of effort on unnecessary optimizations (which is why we really value this tool!).
You might want to doublecheck with the JProfiler website, I’m sure they can confirm it for you.
· June 22nd, 2012 · 11:40 am · Permalink
Very nice and informative article. It higlights the aspect which is missed or lowlighted in most of the development projects.
Thanks for writting this article Steph 🙂
· December 10th, 2024 · 3:49 pm · Permalink
[…] because of it’s complexity. It was very complex to get program, so much so that I wrote a blog post about it on my personal blog about all the efforts we went through to optimize it and make…. This is 2006 where most people are running P3 and P4 computers with 256mb-512mb of RAM for […]